
Page 7 - Tcexpression2021 - Sept to Dec 2020
P. 7
Improvements in industrial processes – 40% Bioenergy – Industries like aviation, marine transport,
emission from metals, mining, chemical, and other and cement manufacturing are challenging to
processes need to be reduced to 2/3rd of 2016 decarbonise through electrification or hydrogen.
levels by 2050. This can be achieved by adopting In these sectors, fossil fuels can be replaced with
a circular economy, improving efficiency and bioenergy using a sustainable conversion of biomass or
optimising operations. waste to energy and feedstock, contributing 3% of total
CO2 reduction by 2050. Figure 9 shows the growth of
Electrifying industrial processes – the most bioenergy in the mix.
considerable emission reduction will come from the
electrification of industrial heat process that can Top uses of bioenergy by 2050, % of each
reduce 65% of the fossil fuel caused CO2 emissions. industry's 2016 CO emissions reduced via
This is mostly applicable for low and medium 2
temperature-based industries like construction, bioenergy
food, textiles, and manufacturing.
Ethylene 23%
Decarbonisation of Power and Fuel:
Aviation 21%
Renewables – Approximately two-thirds of the current
global power generation is from fossil fuel sources of Ammonia 15%
coal and natural gas, generating 40% of the total CO2
emissions. Increase in wind power to five times and Marine 15%
solar power to eight times the current levels would be transport
required to achieve decarbonisation targets by 2030. Iron & Steel 12%
Hydrogen – Electrification alone may prove inadequate Cement 8%
for decarbonising industries like steel making. These
industries would require the use of low-carbon Global 3%
hydrogen generated from renewable power sources average
(“green” hydrogen) or by using natural gas with
carbon capture (“blue” hydrogen). Figure 8 shows the Fig. 9: Demand growth for Bioenergy
6
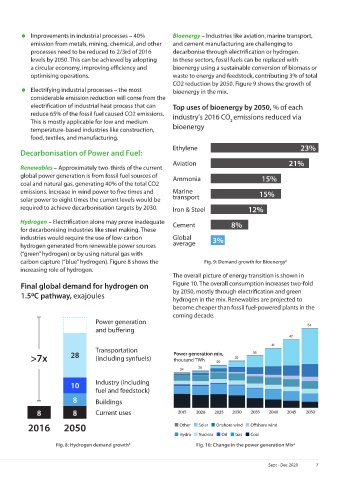
increasing role of hydrogen.
The overall picture of energy transition is shown in
Final global demand for hydrogen on Figure 10. The overall consumption increases two-fold
1.50C pathway, exajoules by 2050, mostly through electrification and green
hydrogen in the mix. Renewables are projected to
become cheaper than fossil fuel-powered plants in the
coming decade.
Power generation
and buffering
Transportation Power generation mix,
>7x 28 (including synfuels) thousand TWh
10 Industry (including
fuel and feedstock)
8 Buildings
8 8 Current uses
2016 2050 Other Solar Onshore wind Offshore wind
Hydro Nuclear Oil Gas Coal
Fig. 8: Hydrogen demand growth Fig. 10: Change in the power generation Mix 2
6
Sept - Dec 2020 7