
Page 4 - Tcexpression2021 - Sept to Dec 2020
P. 4
ENERGY TRANSITION
OUTLOOK
lobal energy demand grew at a compounded
annual growth rate of 3% p.a. between 1950
to 2000 mostly spurred by growth in the
GWestern world. The growth rate continued
at 2% between 2000 to 2015 on the backdrop of
accelerated industrialisation in China. However,
during this time, concerns over climate change and
adverse impacts due to rising Greenhouse gas (GHG)
emissions started to alter the energy vision, leading to
the birth of energy transition. A landmark agreement
of restricting global temperature rise to less than 2°C
above the pre-industrial level by 2050 was adopted in
Paris by 190 state parties in 2015. Many countries made
a conscious effort to effect changes in the energy mix
commensurate with a reduction in carbon-intensive
fuel dependence. It is also expected that the growth in
global energy demand will fall by less than 1% per year
between 2015 to 2030 and further halve to 0.5% per
4
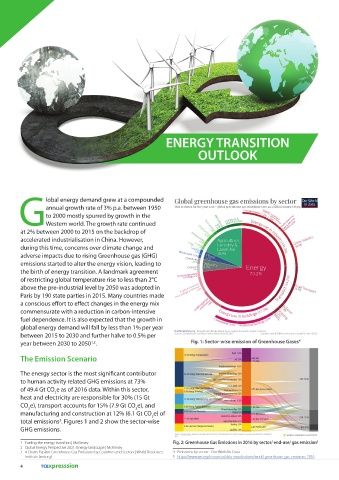
year between 2030 to 2050 . Fig. 1: Sector-wise emission of Greenhouse Gases
1,2
The Emission Scenario
The energy sector is the most significant contributor
to human activity related GHG emissions at 73%
of 49.4 Gt CO e as of 2016 data. Within this sector,
2
heat and electricity are responsible for 30% (15 Gt
CO e), transport accounts for 15% (7.9 Gt CO e), and
2
2
manufacturing and construction at 12% (6.1 Gt CO e) of
2
total emissions . Figures 1 and 2 show the sector-wise
3
GHG emissions.
1 Fueling the energy transition | McKinsey Fig. 2: Greenhouse Gas Emissions in 2016 by sector/ end-use/ gas emission 5
2 Global Energy Perspective 2021: Energy landscape | McKinsey
3 4 Charts Explain Greenhouse Gas Emissions by Countries and Sectors | World Resources 4 Emissions by sector - Our World in Data
Institute (wri.org) 5 https://www.wri.org/resources/data-visualizations/world-greenhouse-gas-emissions-2016
4 TCExpresssion